To create a pivot report showing sums, averages, and other analytics of your call volume divided up by HCPCS code, follow these steps:
- Create a new report and include the Dispatches-Overview and Dispatches-Financial datasets.
- Open the sidebar, if it's not already open.
- In the sidebar, switch to Pivot Mode.
- In the sidebar, in the columns list, find "Activation Month" and drag it to the Row Groups box.
- Still in the columns list, in the "Dispatches-Financial" column group, find "Billable Service Code" and drag it to the Column Labels box.
- Still in the columns list, find "Payments Received" and drag it to the Values box.
- Click the "Group" column header to sort the data by month.
Showing an Average Instead of a Sum
If you want to use AVG instead of SUM as your aggregation function, just click the item in the Values box and switch its function. You will then probably want to activate some or all of these filters to screen out inapplicable rows which would perturb your per-call data:
- Is Billable = true
- Execution Status = not "Delegated to affiliate"
Adding a Chart
It's easy to chart the data:
- Click and drag in the grid to select all rows and columns.
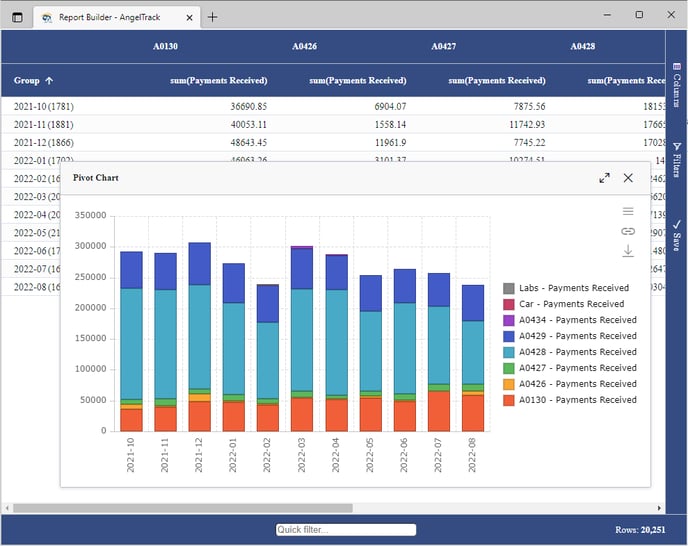
- Right-click the selected area, select "Pivot Chart", and then "Column", then "Stacked".
- Move, resize, and reformat the chart to suit your tastes.
Here is how the completed chart looks:
Other Ideas
Instead of grouping the data by month, you could try these other columns in the Row Groups box in order to see where your best revenues come from:
- Origin City
- Complaint
- Bill To Facility
- Primary Ins Provider Name
- Primary Ins Carrier Type
You can even have multiple columns in the Row Groups box, to create a dive-down. For example, your first grouping could be Activation Month, and your second grouping could be Primary Ins Carrier Type, so that each month can be expanded to show revenue by carrier type.