If you have not yet looked at the article about revenue reporting by means of payor-centric datasets (rather than dispatch-centric datasets), please read over that first, and then this walkthrough will make more sense.
To create a simple analysis of revenue by payor, do this:
- Create a new report using the "PaymentEvents-Nonzero" dataset from the "Payment Events" category.
- In the sidebar, switch the report to pivot mode.
- In the columns list, find "Received Month" and drag it down to the "Row Groups" box.
- In the columns list, find "Counterparty Ins Carrier Type" and drag it down to the "Column Labels" box.
- In the columns list, find "Amount Received" and drag it down to the "Values" box.
- If you like, you can filter out the monies received from affiliates, facilities, and patients by going to the sidebar, selecting the "Columns" tab, finding "Counterparty Type", and excluding everything except "Insurance".
You can also reverse the pivot, by placing "Received Month" in the "Column Labels" box, and "Counterparty Ins Carrier Type" in the "Row Groups" box. That will give you one column per month, rather than one column per counterparty type.
Adding a chart
To quickly chart the data:
- Click and drag in the grid to select all rows and columns.
- Right-click the selected area, choose "Pivot Chart", "Column", and then "Stacked".
- Move and resize the chart to suit your tastes.
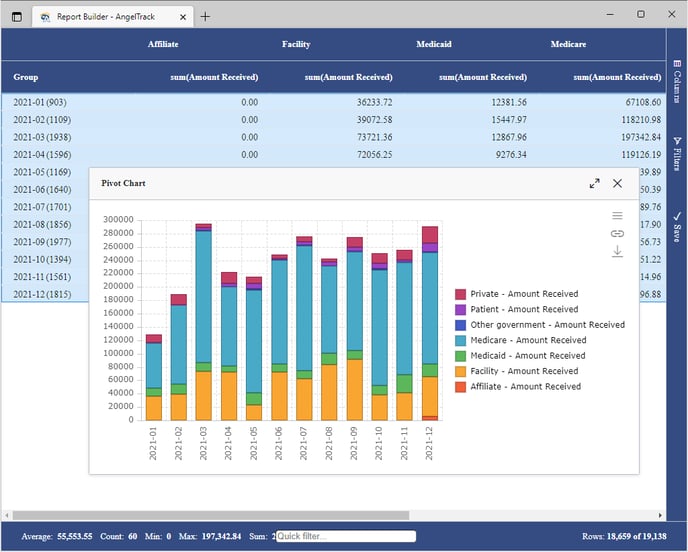
Here is how your completed chart will look: