To create your first chart, follow these steps:
- From the Data Hub, select the "Dispatches-Overview" and "Dispatches-Runtimes" datasets, and then click the "Launch New Report" button.
- From the report's sidebar, in the "Columns" tab, deselect both datasets so that all columns disappear from the report.
- Still in the sidebar, drag the columns "Service Requested" and "Priority" down to the "Row Groups" box.
- Still in the sidebar, drag the column "Minutes Enroute" down to the "Values" box, and then click it to change its aggregation function from SUM to AVG.
- From the grid, for each service level shown in the "Service Requested" column, click the > icon to expend the group by one level. Each service level will then show a few child rows -- one per priority.
- From the grid, click and drag to select all visible rows and columns.
- Right-click the selection area, select "Chart Range", and select "Column", and then "Grouped".
Here is how your completed chart will look:
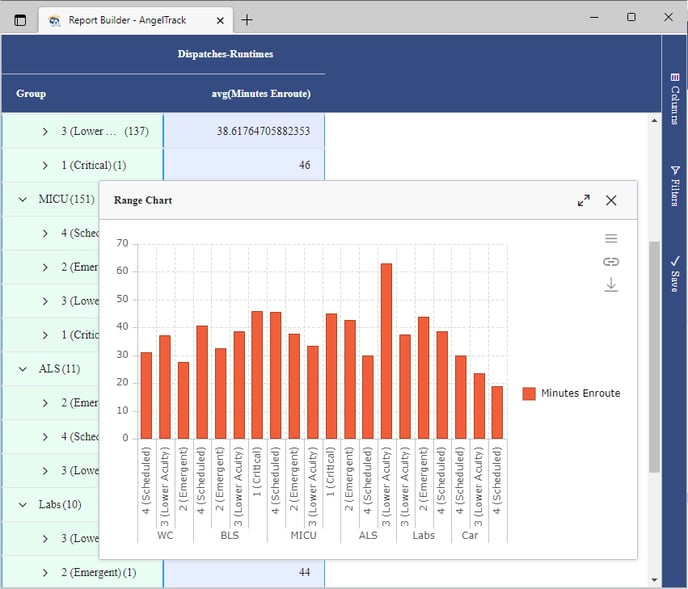
Using the chart's ≡ icon in its menu at the top-right corner, you can adjust the included columns, and dress up the chart in different colors and styles.
You can also adjust the chart's range (the area of rows and columns to be plotted) using the drag handle located in the bottom-right corner of the chart's blue selection box in the grid.
If the chart seems cramped, you can resize it right in the grid, by hovering your mouse over any of its edges. You can also hide the chart's side-menu by clicking elsewhere in the chart.
To download an image of the completed chart, click the ⤓ icon in the chart's menu at the top-right corner.