To create a report showing one column per month of data, do this:
- Activate the "Pivot Mode" switch at the top of the sidebar.
- From the datasets/columns list, find the "Activation Month" (or other by-month) column, and drag it to the "Column Labels" box.
- From the datasets/columns list, find a column you wish to aggregate, and drag it to the "Values" box. For example, you might aggregate the Payments Received column in order to see what you were paid during each month. The grid will then show the aggregation of each row group.
- To then subdivide the payment totals, find a column to act as the divisor, and drag it to the "Row Groups" box. For example, you might subdivide the payment totals by priority level, or complaint, or service provided, in order to see a subtotal for each different type of call.
- For convenience, click the ≡ icon in the group column's header, and pin it to the left, so that it will remain in view as you scroll to the right.
Here is how your completed report will look:
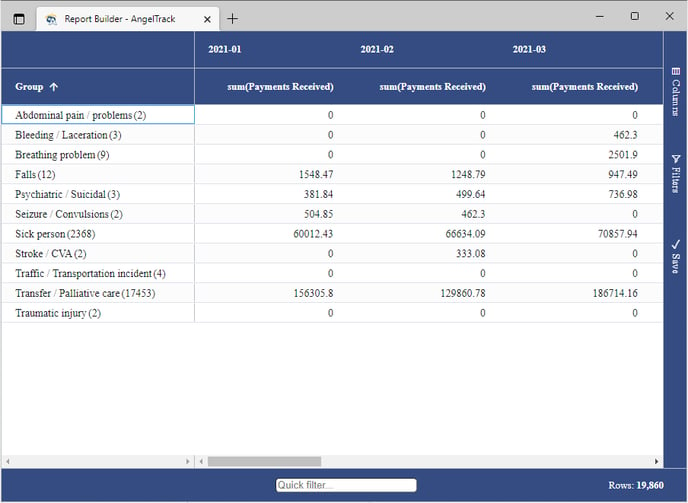
You can then click and drag to add a chart of the data.