AngelTrack's Dispatcher Efficiency Report attempts to measure the efficiency of your dispatchers by analyzing their trip assignments.
Gain Finding
Highly effective dispatchers will typically make an effort to look for potential gains, or opportunities to eliminate slack mileage, but ensuring that the origin of one call is as close as possible to the destination of the call before. Such "gains" can drastically reduce the efficiency of an EMS opportunity, as each truck on the road costs the agency an eye-watering amount of money. AngelTrack understands the importance of performance metrics, and using its run data, the system recognizes and provides data for two types of gain: overlaps and doubles.
Overlaps
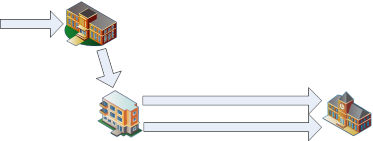
An overlap is where the transport leg of one trip is also the enroute leg of a second trip, like this:
| 10:00 am | 10:15 am | 10:30 am | 10:45 am | 11:00 am | 11:15 am | |
|---|---|---|---|---|---|---|
| Trip 1: | Enroute | On-scene | Transporting | At destination | ||
| Trip 2: | Enroute | On-scene | Transporting | At destination |
Overlaps wipe out all the slack mileage of trip 2's enroute leg, so they are a big savings.
The efficiency report identifies overlaps by looking for pairs of calls where:
- trip 1's destination is within one mile of trip 2's origin, and
- the crew arrived at trip 1's destination within an hour of arriving at trip 2's origin (so as to exclude situations where the crew wanders off before returning for trip 2)
Doubles
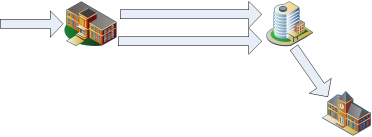
AngelTrack is also familiar with the concept of double-loading, where two patients are both headed to the same destination and so are loaded into the same vehicle:
| 10:00 am | 10:15 am | 10:30 am | 10:45 am | 11:00 am | 11:15 am | |
|---|---|---|---|---|---|---|
| Trip 1: | Enroute | On-scene | Transporting | At destination | ||
| Trip 2: | Enroute | On-scene | Transporting | At destination | ||
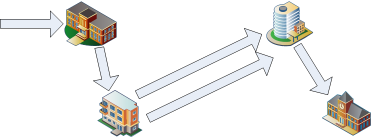
...or both picked up from the same origin, and headed to two destinations in the same area:
| 10:00 am | 10:15 am | 10:30 am | 10:45 am | 11:00 am | |
|---|---|---|---|---|---|
| Trip 1: | Enroute | On-scene | Transporting | At destination | |
| Trip 2: | Enroute | On-scene | Transporting | At destination | |
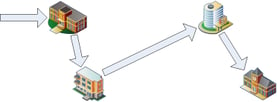
...or from two different origins, headed for two different destinations, but riding together in the same vehicle:
| 10:00 am | 10:15 am | 10:30 am | 10:45 am | 11:00 am | 11:15 am | 11:30 am | |
|---|---|---|---|---|---|---|---|
| Trip 1: | Enroute | On-scene | Transporting | At destination | |||
| Trip 2: | Enroute | On-scene | Transporting | At destination | |||
The efficiency report identifies the rate that each dispatcher creates double-loads, and calculates the approximate mileage saved. This is called the "Average Distance Per Double", expressed as a percentage of the worst-case scenario of running the two calls as singles. You can visualize the calculation like this:
| Step 1: | Calculate the mileage of running the two calls as a double load: | |
|---|---|---|
|
20 miles | |
| Step 2: | Calculate the worst-case mileage, if the two calls were run as singles: | |
|
50 miles | |
| Step 3: | Divide to get a percentage, showing what percent of the worst case was achieved. |
20 miles ÷ 50 miles = 40% (a savings of 60%) |
So we see that the "Average Distance Per Double" should be as low as possible; lower numbers mean that fewer miles were run, compared to the miles needed to run the calls separately. Clever rearranging and dispatching is required to find very many doubles on a typical call schedule.
Singles
A single is the transport of a single patient one way, without an overlap at either end. Because every single has an enroute leg consisting of slack mileage, they are the most costly runs (versus overlaps and doubles).
To minimize slack mileage, the dispatcher's can (in addition to finding gains in overlaps and doubles) deploy the crews from single to single such that each call leaves the crew close to their next pickup. A smart and efficient dispatcher keeps a mental map, or uses AngelTrack's live map, to visualize of where all crews are, and where the next calls are.
The efficiency report estimates how often your dispatchers achieve this goal, by measuring the enroute distance a crew travels between one single and the next.
Help from AngelTrack
AngelTrack's Live Map can help dispatchers visualize the day's call schedule. If you switch the map into Shift Mode, it can show each shift's route plan, as well as nearby dispatches that could be assigned with little slack mileage.
Late Pickups and Late Dropoffs
Each dispatcher's rate of late pickups (more than 20 minutes late to an origin with an appointed arrival time) and late dropoffs (more than 20 minutes late to a destination with an appointed arrival time) is included in the efficiency report. When viewing the data, bear in mind these situations:
- Apprentice dispatchers, and dispatchers unfamiliar with the area, will typically have more lates until they develop a sense for how long the calls on the schedule will take.
- Good-intentioned dispatchers who are working hard to find gains will have more lates than those dispatchers who are prioritizing on-time arrival.
Caveats to the Report
This report has many caveats, and in any case does not paint a complete picture of your dispatchers' talents.
Nights and weekends
For EMS operations focused on transport (rather than 911), the nights and weekends are sparse, and the calls are widely spaced with few chances for gains. Consequently, the efficiency report allows you to check ☑ Hide calls occurring at night or on weekends box to analyze your dispatchers activities during business hours only -- 6am through 8pm weekdays.
Balancing utilization and on-time performance
As a general rule, higher crew utilization means more late pickups, as crews are kept busy rather than waiting for their next call. When utilization is low, there is ample time to drive to the next pickup.
If your company is reducing staff levels in order to increase utilization, then late pickups must increase. Clever dispatching can only do so much when there are not enough crews on hand during the busy times.
Wheelchair/ambulatory is the land of doubles
Remember that double-loads are (in most states) impossible with BLS+ transports. Consequently, if one of your dispatchers does mostly stretcher, they will turn in fewer gains than those dispatchers who handle a more balanced mix of stretcher and wheelchair/ambulatory.
Triple loads
A triple load counts as one single (the first trip, judged for distance from the crew's previous call) plus two doubles.
Catch-and-release calls
Catch-and-release calls do not appear in the efficiency report -- whether or not transport was requested.
Move the report's date range
Use the efficiency report's date controls to slide the date range forward or backward in order to see how your individual dispatchers are improving.