The Call Volume by Day of Week report analyzes dispatch records in the recent past in order to predict call volume in the future.
Recent call volume is broken down by service level, by day of the week, and then by time of day. So, the chart can show you -- for example -- how many simultaneous stretcher calls you have had at 8:00 AM on Mondays. This information can then inform your staffing decisions.
The report excludes all of the following:
- Any calls marked ✘ Cancelled, on the understanding that cancellations are analyzed separately in the Call Cancellation Reasons Report
- Will-call dispatches
- Any call that is active for an abnormally long time (longer than six hours)
The report includes calls marked ✔ Delegated to Affiliate, on the understanding that these represent call volume that you would prefer to handle in-house.
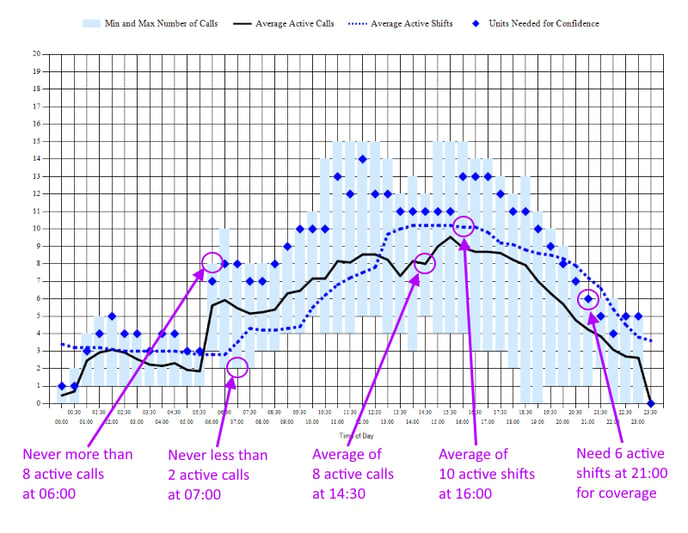
The candlestick chart conveys five pieces of information for each 30-minute time period:
-
Minimum
The bottom of each light-blue column shows the smallest number of simultaneous dispatches (i.e. calls which are active) at that time and day of the week, based on data from the specified date range.
-
Maximum
The top of each light-blue column shows the largest number of simultaneous dispatches (i.e. calls which are activated and not closed) at that time and day of the week, based on data from the specified date range.
-
Average
The black line shows the average number of simultaneous dispatches (i.e. calls which are activated and not closed) at the specified service level at that time and day of the week, based on data from the specified date range.
-
Confidence (blue diamonds)
The blue diamonds show the patient capacity needed in order to be 90% confident (or whatever confidence interval you've selected) of being able to handle the call volume at that time of day, on that day of the week. This is probably the best statistic to use in deciding how many units to schedule on each day of the week.
Keep in mind, the diamonds show the number of units needed to immediately respond to the anticipated call volume. You don't always need to immediately respond; depending on your relationship with your contracted facilities, a one-hour response time may be acceptable. If your contracted facilities are tolerant of long response times, then lower your confidence interval to perhaps 80% and check the graph again.
The confidence number shows the necessary patient capacity. For BLS+ services, this is the same as the number of active shifts, because ambulances normally can transport only one patient at a time. For wheelchair, gurney, and car service, on the other hand, double-loading gives each vehicle a patient capacity of 1.5, rather than 1.0; see explanation below.
-
Staffing Level (blue dotted line)
The blue dotted line shows the patient capacity that was available at the designated time, averaged over the selected date range. Patient capacity is equal to the number of active shifts, plus a double-loading factor for wheelchair vans, gurney vans, and service cars; see explanation below.
Compare this line to the confidence diamonds -- and to the call-volume indications -- to identify timespans where you are under- and over-staffed.
Plotting the staffing level of shifts is a complex issue when ALS shifts can cover BLS calls but not vice versa; likewise for MICU shifts covering ALS and BLS calls, and for all stretcher units covering wheelchair, ambulatory, and gurney calls. Read on for details.
The "Underlying Data" grid below it contains additional analyses:
-
Median
This is the statistical median value, reflecting the median number of calls that were active during the selected timeslot.
-
Mode 1
This is the statistical mode value, reflecting the most common number of calls that were active during the selected timeslot. For example, if during a three-month period, the active calls on Mondays at 13:30 are 6, 7, 7, 7, 6, 7, 7, 5, 7, 6, 7, 7, 6, 5, and 7, then 7 is the most-common value in the data-set, and so will be reported as Mode 1. The "Mode 1 Probability" column shows how likely that the Mode 1 value (7 in this case) will appear in the Monday 13:30 timeslot.
-
Mode 2
This is the secondary statistical mode, reflecting the second-most common number of calls that were active during the selected timeslot. In the example given above, 6 will be reported as Mode 2.
Patient Capacity and Double Loading
If you have wheelchair vans, gurney vans, and service cars that can double-load (i.e. that are marked as having a normal patient capacity of 2 or more), this will factor in to AngelTrack's coverage analysis. You can disable that by unchecking the box ☑ Vehicles that can double-load under normal circumstances should be counted as a patient capacity of 1.5.
As long as that box is checked, the relevant shifts will be counted as capacity 1.5, rather than 1.0, reflecting the fact that they spend about half their time double-loaded. This helps to match up real-world performance with the demand for capacity, at least for your car, wheelchair, and gurney services.
Staffing Level and Service Levels Caveat
This report can perform staffing level analysis to help you identify days and times when you have too many or too few units on-duty.
HOWEVER, the analysis is too simple to be useful for providers with multiple EMS service levels, such as BLS plus wheelchair, or ALS plus BLS, when higher-level units can cover lower-level calls.
For that kind of analysis, look at the Shift Utilization report instead, or use the per-service staffing projections offered by the Shifts Calendar which is part of the crew scheduler.
Interpretation Examples
To help you learn to interpret the graph, here are some examples.
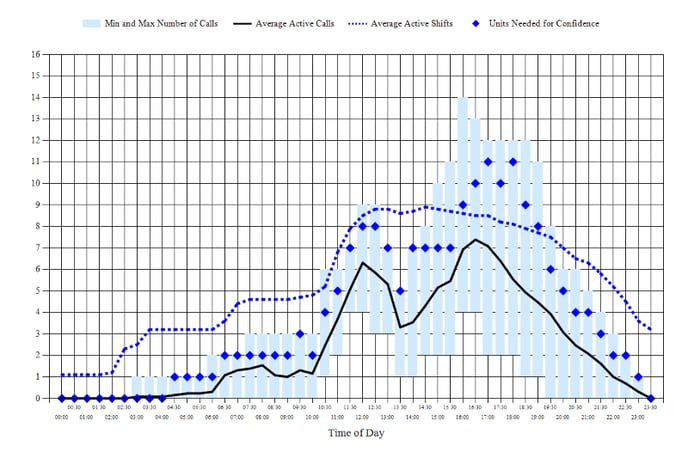
Sample 1: Understaffed
This operation is understaffed in the morning until about noon: notice that the average call volume (heavy black line) and the confidence diamonds are both high above the average staff level (dotted blue line). After noon, the staff level rises to hover in the correct zone (between the average call volume and the confidence diamonds).
From 21:00 onward the operation appears to be overstaffed by two units, but this is just crews sitting at the station finishing their reports and cleaning their trucks. Such things should be done throughout the day (in-between calls) instead of in the evening, since AngelTrack allows crews to work on their reports while in the field.
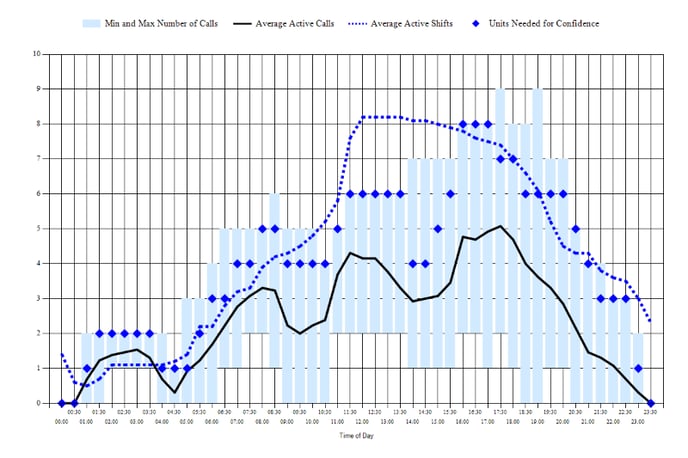
Sample 2: Very small operation
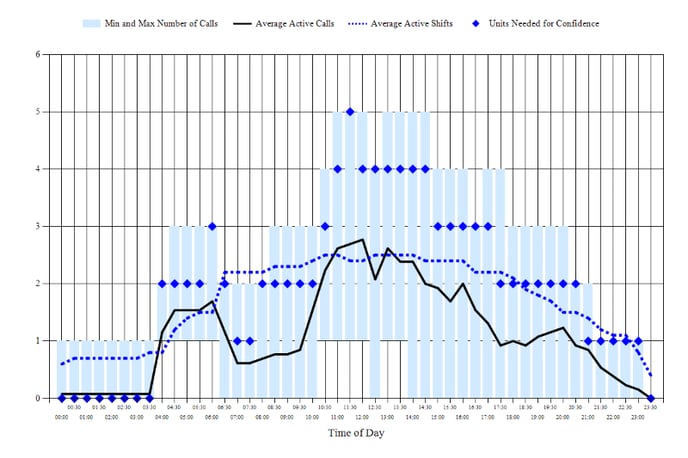
This EMS operation has only three trucks, and is attempting to cover a dialysis hump while also catching surges of ER calls that arrive erratically throughout the day. It looks like they have two front-line ambulances plus a reserve ambulance (perhaps older and less reliable) that participates on some days as a third shift.
Covering at 90% confidence is done for the purpose of growing the business by being always available... but it requires the up-front investment of fielding additional crews that may or may not get any calls.
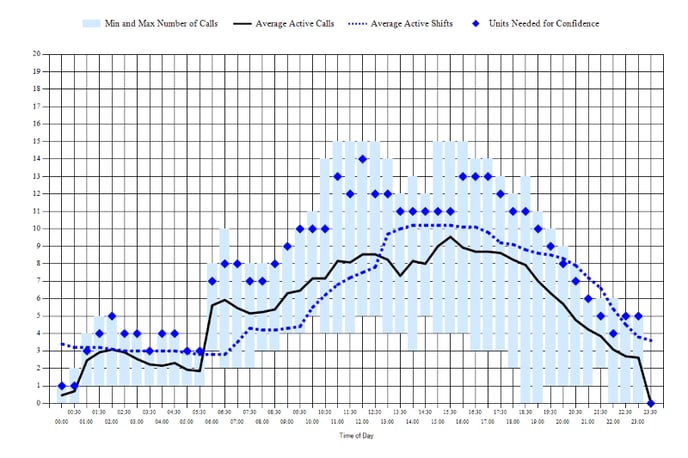
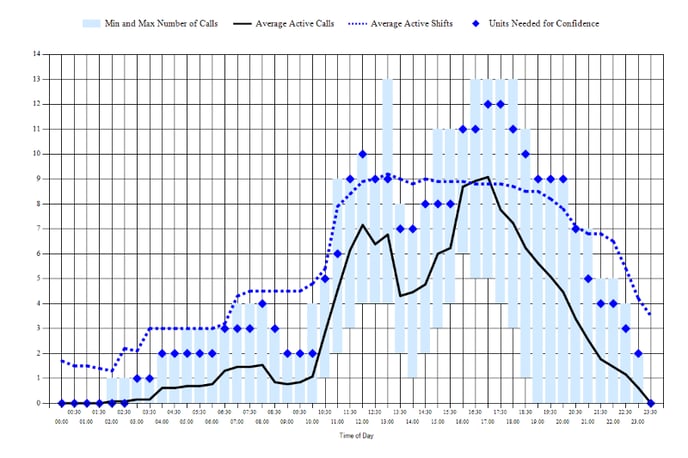
Sample 3: Nearly perfect staffing
This chart shows an EMS operation whose staffing levels are razor sharp, carefully tracking average call volume throughout the day, and then rising to cover the confidence diamonds for the evening surges.
As noted earlier, the apparent mild overstaffing at the end of the day is crews sitting at the station, finishing their reports and cleaning their trucks. This can be somewhat -- but not completely -- reduced by pushing crews to finish their reports while in the field, in-between calls.
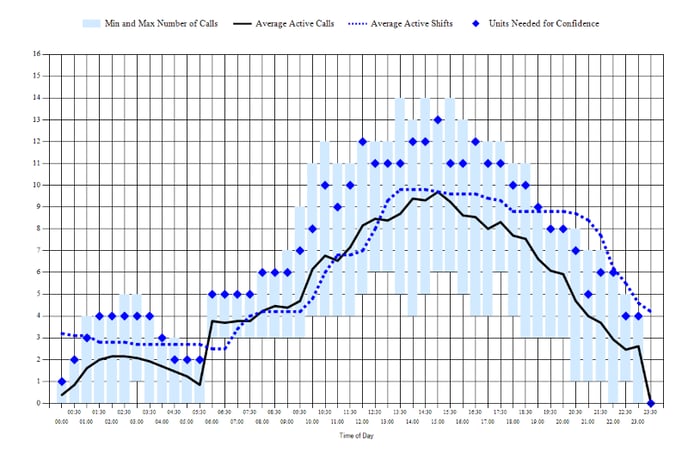
Sample 4: Overstaffing, dialysis humps
This sample shows the characteristic humps of a dialysis caseload, as per usual. However, it is seriously overstaffed: the dotted blue line floats high above the confidence diamonds for most of the day. This is costly, but it might be intentional: the company may be using investment capital to operate overstaffed and therefore highly responsive, in order to attract new business from nursing homes, hospitals, and freestanding ERs.
In the evening the crews are probably finishing their reports and cleaning their trucks, but that can be reduced by requiring them to work on their reports while in the field throughout the day.
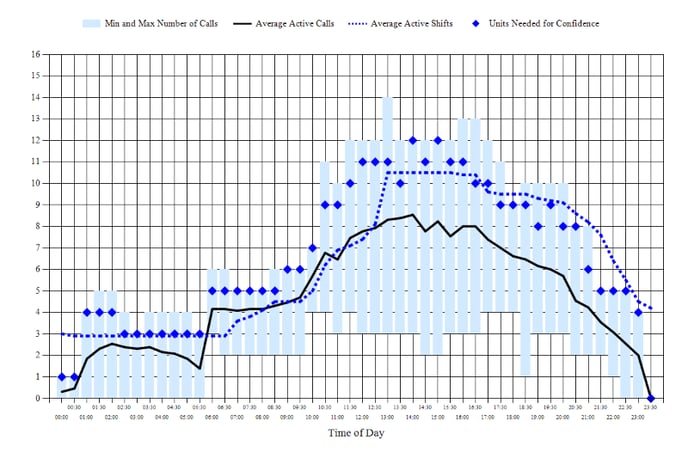
Sample 5: Dialysis humps, afternoon overstaffing
This chart shows the characteristic humps -- spaced four hours apart -- of an EMS operation under a heavy dialysis caseload. Staffing levels after noontime are greatly excessive: the company prematurely ramps up staff (dotted blue line rising at 11:30) for the evening surges (diamonds rising at 16:00).
Between the 8:00 rush, the noon rush, and the 16:00 rush, there are too many units on staff, but there is probably no way to solve this problem unless you can persuade your dialysis centers to rearrange a few patients' chair times. Dialysis centers usually refuse to do so, unless you can come to them with multiple patients who are simply swapping chair times between them.
Sample 6: Confident coverage
This operation is staffing to cover the confidence diamonds, in order to be responsive to its customers... though from 16:00 to 18:30, staff levels cannot rise to follow the confidence diamonds because the company only has nine front-line ambulances -- leaving two in reserve in case of a breakdown or accident.
From 20:00 onward the operation appears to be overstaffed by two units, but this is just crews sitting at the station finishing their reports and cleaning their trucks. Such things should be done throughout the day (in-between calls) instead of in the evening, since AngelTrack allows crews to work on their reports while in the field.
Sample 7: Tight staffing, no surge coverage
All day long until 16:00, this operation staffs at exactly its average call volume, leaving no spare units to handle surges. That means some ER calls will be missed, and last-minute work-ins will be delayed many hours. At 16:00 staff levels rise to better answer the surges.
By 19:30 it has become slightly overstaffed, but as with the other samples, the end-of-day excess staff is probably just crews sitting at the station, finishing their reports and cleaning their trucks.
Extra evening shifts are also sometimes intended to woo new business from a local freestanding emergency room, which usually has a surge of business after the dinner hour and will be grateful to have an EMS company on hot standby.
Look at Several Confidence Intervals Before Making Staffing Decisions
Before making any decisions about staffing levels, look at several different confidence intervals first.
You may discover that a small reduction in confidence -- say from 90% to 80% -- can yield a significant savings in labor costs. The tradeoff is an increase in late pickups and late dropoffs, and a decrease in the number of ER calls you won by having a unit available.
Customers are not willing to pay for 100% on-time service
This chart speaks to a broader question that all EMS companies face: What is an acceptable rate of late pickups / late dropoffs?
Few customers are willing to pay what it would cost to field the large number of crews needed to reach 99% on-time performance. In fact, most customers have never thought about the issue at all, or what it would cost them for their EMS company to meet that lofty goal.
It may be necessary to have a frank conversation with your contracted facilities and with your frequent-flier patients and their families. Explain the problem of paying crews to sit around just in case. Provide them reassurance that you continuously monitor your operation's performance numbers in order to strike the right balance between saving money, driving at a slow and careful speed, and arriving on-time.
This is an important narrative to impart to your customers, to set expectations and properly frame the occasional lateness in terms of labor costs.
AngelTrack can help
AngelTrack provides the monitoring tools and charts to manage your late pickup / late dropoff rates, in order to keep them within an acceptable range. If called to the carpet to answer for complaints about lateness, print the reports and take them with you. If the numbers are good, the reports will exonerate you; if the numbers are not good, the reports will show you are monitoring the problem and are taking it seriously. Relevant reports include:
- The aforementioned chart
- Shifts Utilization Report, showing what percent of their time your shifts are spending enroute, on-scene, transporting, at destination, and idle
- Dispatcher Efficiency Report, showing on-time performance for each individual dispatcher
- Crew Utilization Visualizer, showing how busy your crews are while on shift
- On-Time Performance Report, showing your performance for each individual facility
- On-Time Pickup by Facility, showing all individual pickups for a selected facility, with deep-dive capability for analyzing outliers
- Late to Destination Analysis explains the rate of late arrivals using dispatch and followup data
- Last-Minute Bookings Report shows how much advanced notice each facility is giving your dispatchers, compared to all other facilities of the same type
- Pickup Delays Report analyzes the reasons for delays on-scene, i.e. delays while picking up patients, as given by crews in their followup reports.
- Pickup Delays Comparison Report compares the time spent on-scene at one specific facility versus the average time spent on-scene at all other facilities of the same type. This is useful when educating a facility about their role in causing patients to be late in reaching their destinations.
- Likewise the Dropoff Delays Report and Dropoff Delays Comparison Report analyze the reasons for delays at destination, which helps to identify facilities that impose an unreasonable delay accepting the transfer of care of patients at the end of their transport.
Remember also the Customer Portal, which your facilities can use to monitor their call schedule and the progress of assigned crews.